Establishing a Pure Baseline: Define the baseline conversion rate from a clean period before the UX change, using the exact same traffic source, device mix, and conversion definition throughout the test. This methodological rigor ensures the calculated lift is comparable instead of mixing in outside noise or seasonal anomalies.
Validating and Translating to Revenue: Validate the result with enough sample size and a controlled test window, then translate the lift into incremental leads or pipeline revenue. Because short tests can overstate performance, it is imperative to use statistically sound results and compare them against actual business impact, not just a better-looking rate.
Introduction: The 2026 Paradigm of Search and Conversion Efficiency
The digital visibility landscape has undergone a foundational restructuring by the year 2026. The proliferation of generative artificial intelligence has fundamentally altered how search engines evaluate, index, and present information to the consumer. For Small and Medium-sized Enterprises (SMEs), generating raw traffic volume is no longer a viable standalone indicator of commercial success. As algorithms transition from providing traditional blue links to acting as direct answer synthesizers, the efficacy of digital marketing is increasingly defined by downstream metrics: specifically, the ability of a landing page to convert acquired traffic into measurable pipeline revenue.
A poorly structured or aesthetically outdated landing page functions as a severe fiscal leak, rapidly draining the return on investment (ROI) generated by high-cost advertising and optimization campaigns. Current industry benchmarking data indicates that the median landing page conversion rate across all sectors hovers at approximately 6.6%. However, a closer examination of the data reveals a profound performance gap: the top 25% of landing pages achieve conversion rates exceeding 10%, while the bottom quartile struggles below 3%. This discrepancy is rarely a product of traffic quality; rather, it is driven almost entirely by strategic User Experience (UX) design, technical architecture, and rigorous Conversion Rate Optimization (CRO) methodologies.
Bridging this performance gap requires a highly analytical, scientifically sound approach to digital marketing. It necessitates deploying precise UX enhancements, utilizing rigorous mathematical formulas to calculate the resulting lift, and proving the financial impact to stakeholders through undeniable statistical significance. Furthermore, optimization in 2026 must account for the integration of emerging frameworks such as Generative Engine Optimisation and Answered Engine Optimisation, which dictate that a landing page must satisfy both human cognitive processes and the extraction requirements of sophisticated AI agents.
The Baseline: Constructing a Scientifically Valid Control
The foundation of any credible conversion rate optimization initiative is the establishment of a pristine control metric. Before any UX modifications—such as altering a Call-to-Action (CTA) placement, streamlining a form, or upgrading server response times—can be evaluated, the historical performance of the page must be perfectly quantified. Without a rigid, uncontaminated baseline, subsequent calculations of conversion rate lift become scientifically invalid, leading to erroneous business decisions and misallocated capital.
Defining the Clean Period
The first requirement of baseline construction is defining the conversion rate from a “clean period” immediately preceding the UX intervention. A clean period is defined as a specific timeframe devoid of external market anomalies, technical disruptions, or atypical traffic surges that could artificially inflate or depress user behavior.
If a baseline is calculated during a highly promotional period—such as a localized holiday sale or a viral social media event—the conversion rate will be unnaturally high. Comparing a new UX design launched during a standard operating week against this hyper-inflated baseline will falsely suggest that the new design is failing. Conversely, establishing a baseline during a period of server instability will set the performance bar artificially low, resulting in a false positive when the new UX is tested. By isolating a stable, representative operational window, data analysts ensure that the baseline reflects the true historical utility of the landing page.
Isolating Traffic Sources and Intent
A critical and pervasive error observed during professional Marketing consultation is the failure to control for audience variables across the testing horizon. To guarantee that the calculated lift is genuinely comparable instead of mixing in outside noise, the exact same traffic source parameters must be maintained throughout the pre-test and post-test periods.
Different digital acquisition channels inherently possess varying degrees of commercial intent. For example, high-intent traffic generated via Search Engine Marketing (PPC) historically converts at approximately 10.9%, as these users are actively querying specific solutions. In contrast, traffic sourced from generalized display networks or early-stage informational content may convert at significantly lower rates due to longer consideration cycles. If the baseline data is heavily weighted with high-intent search traffic, but the post-UX-change data is inadvertently flooded with low-intent social media traffic, the overall conversion rate will likely plummet. An untrained observer might blame the new UX design, completely missing the fact that the underlying traffic quality was the actual variable that changed.
Controlling Device Mix and Conversion Definitions
Device fragmentation introduces another layer of statistical complexity. In 2026, mobile platforms account for an overwhelming majority of global website traffic, often exceeding 62% generally and up to 82.9% for specific landing page interactions. Mobile users exhibit unique behavioral patterns, characterized by shorter attention spans, lower tolerance for slow load speeds, and different physical interaction requirements, such as thumb-friendly tap targets.
A scientifically valid baseline must cleanly segment these users. The mobile baseline performance must be compared strictly against mobile post-change performance, and desktop against desktop. Blending these metrics obfuscates the true impact of the UX change, as a design that improves mobile conversion might simultaneously degrade the desktop experience.
Finally, the definition of a “conversion” must remain absolute and immutable. If the baseline metric defines a conversion as a fully completed, multi-step lead generation form, the post-change metric cannot suddenly redefine a conversion as a simple newsletter signup or a button click. Maintaining strict variable control across the traffic source, device mix, and conversion definition ensures that any observed lift is exclusively attributable to the UX modifications deployed.
The Mathematics of Conversion Rate Lift
When digital marketing analysts present performance data to corporate stakeholders, the language of digital analytics must align flawlessly with the language of corporate finance. Misinterpreting how conversion changes are mathematically calculated can lead to severe misallocations of capital and fundamentally flawed revenue projections.
The Fallacy of Absolute Improvement
A common, yet highly detrimental, misconception in digital analytics is conflating an absolute percentage-point increase with a relative performance lift. If a B2B landing page’s conversion rate increases from a baseline of 5% to a new rate of 6% following a UX redesign, an inexperienced analyst might report a “1% increase.”
While mathematically accurate in absolute terms, reporting a 1% change drastically understates the commercial reality of the improvement. To a Chief Financial Officer, a 1% improvement often sounds negligible, making it exceedingly difficult to justify the budget expended on the UX research, copywriting, and technical development required to execute the change.
Calculating Relative Improvement
In rigorous commercial analytics, lift must be calculated as a relative improvement, not just a raw percentage-point change. Relative lift measures the percentage growth of the conversion rate itself, reflecting the actual proportional increase in customer acquisition.
To calculate the true business impact of a UX enhancement, data scientists rely on the standard relative improvement formula:

Applying this formula to the previous example yields a vastly different narrative:
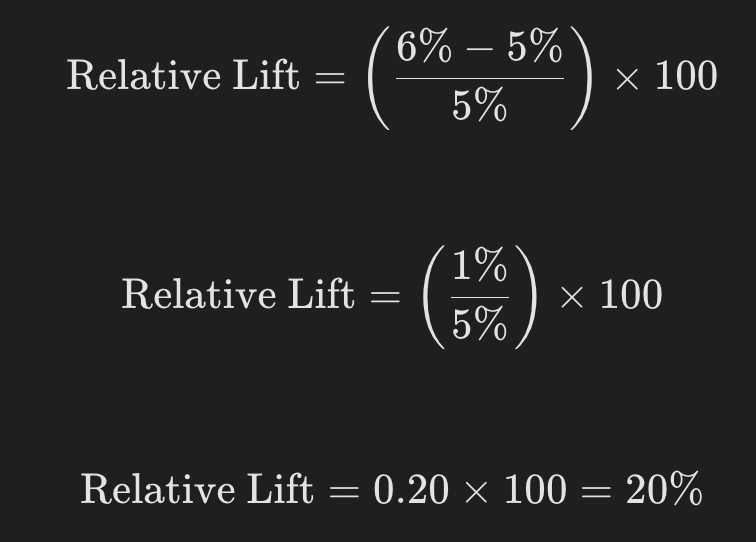
Moving from a 5% baseline to a 6% conversion rate represents a 20% relative lift. This specific figure is significantly easier to communicate in business terms. A 20% relative lift translates directly to a 20% increase in total lead volume generated from the exact same advertising expenditure. By articulating the metric in relative terms, the marketing apparatus effectively demonstrates how the UX change fundamentally altered the unit economics of the enterprise, lowering the Customer Acquisition Cost (CAC) and increasing the overall return on ad spend.
Statistical Significance and the Danger of False Positives
A calculated relative lift of 20% is mathematically correct, but it is practically useless if the data underlying the calculation is not statistically significant. In the realm of Conversion Rate Optimization, statistical significance serves as the mathematical proof that the observed lift is the direct result of the new UX design, rather than random chance, standard deviation, or localized traffic anomalies.
The Architecture of Hypothesis Testing
Every UX modification must begin with a formal hypothesis and a corresponding null hypothesis. The null hypothesis posits that the UX change will have no effect on the conversion rate, and that any observed differences between the control (baseline) and the variant are purely coincidental. The objective of the A/B test is to gather enough data to confidently reject the null hypothesis.
Digital platforms in 2026 provide real-time data streaming, creating a dangerous temptation for organizations to declare a winning variation prematurely. Short tests can overstate performance. For example, a new UX design launched on a Friday might show a massive 50% relative lift over the weekend. However, if the business historically experiences higher weekend conversion rates due to consumer browsing habits, stopping the test on Monday will yield a false positive. Acting on noise rather than signal leads to implementing changes that actually degrade long-term revenue.
Validating Through Sample Size and Time Horizons
To prevent false positives, it is imperative to validate the result with enough sample size and a controlled test window. Statistical rigor demands that a test must run long enough to account for all behavioral cycles, meaning an absolute minimum duration of 14 days is required to capture full weekday and weekend fluctuations, regardless of how quickly traffic volume accumulates.
Furthermore, the data must reach a minimum statistical confidence level—the industry standard being 95% (represented by an alpha value of 0.05). A 95% confidence interval means that if the exact same test were run 100 times, the true conversion rate would fall within the observed range 95 times, leaving only a 5% probability that the result is a random anomaly.
The calculation of statistical significance involves complex variance analysis, specifically standard deviation and standard error calculations:
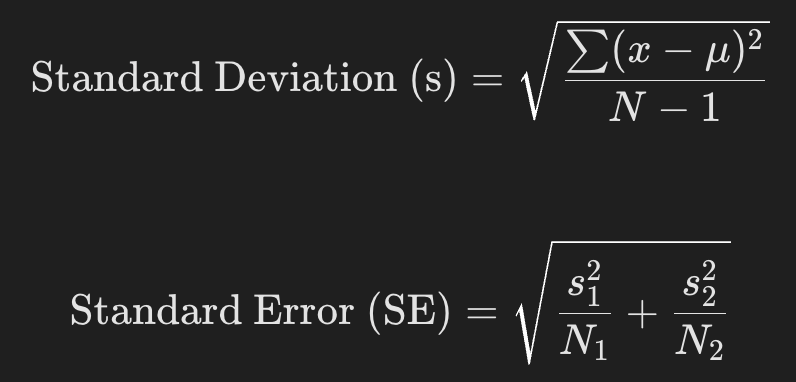
Where μ represents the mean, N represents the sample size, and s represents the deviation of each group. Because detecting a minor incremental lift (e.g., a Minimum Detectable Effect of 2%) requires exponentially larger sample sizes than detecting a massive behavioral shift, analysts must rely on precise sample size calculators prior to launching a test. Decisions must be made using statistically sound results, ensuring that corporate capital is invested in verified UX wins rather than fleeting data mirages.
Architecting High-Converting Landing Page UX in 2026
Achieving a statistically significant relative lift requires implementing UX modifications grounded in established psychological principles and rigorous technical frameworks. Data collected across millions of visitor interactions in 2026 highlights several specific UX elements that consistently drive substantial performance improvements across various industry verticals.
Industry-Specific Conversion Benchmarks
Understanding where a landing page sits relative to industry peers provides necessary context for optimization efforts. The following table details median and top-quartile conversion benchmarks across key sectors:
| Industry Sector | Median Conversion Rate | Top 25% Performers | Contextual Drivers of Lift |
|---|---|---|---|
| B2B Services | 13.3% | 20.0%+ | High intent queries, specialized problem resolution. |
| B2C General | 9.9% | 15.0%+ | Urgency triggers, emotional copy, visual appeal. |
| Finance & Insurance | 6.2% | 12.0%+ | Strong trust signals, security badges, risk reduction. |
| Legal Services | 5.4% | 10.2%+ | Credentialing, transparent reviews, authoritative tone. |
| SaaS / Software | 3.8% – 4.2% | 8.0%+ | Long consideration cycles; trials convert higher than demos |
The Hero Section: Above the Fold Optimization
The structural reasons landing pages fail frequently occur before the user even begins to scroll. The “hero section”—the area visible immediately upon page load—serves as the critical three-second pitch. High-converting pages feature a benefit-led headline that clearly articulates the resolution to the user’s pain point, supported by a value proposition of under thirty words.
A primary driver of relative lift in this section is the consolidation of action. Pages featuring a single, hyper-focused Call to Action (CTA) convert 266% better than pages offering multiple competing actions. By removing the main website navigation bar from the landing page, the UX eliminates escape routes, forcing the user to focus entirely on the singular conversion mechanism, a tactic proven to generate a 100% relative improvement in specific A/B tests. Furthermore, personalization of the CTA copy—shifting from generic “Submit” to benefit-specific language such as “Get My Free Audit”—can boost conversions by an additional 42%.
Friction Reduction and Cognitive Load
Every additional cognitive hurdle placed between the user and the desired action degrades the conversion rate. This is most evident in lead capture form design. Analytical data indicates that reducing the number of form fields from eleven down to four generates a 120% relative conversion lift. To combat form abandonment without sacrificing vital lead data, advanced UX architectures now employ progressive multi-step forms. Starting with a low-friction question gets the visitor mentally committed through the psychological principle of micro-commitments before asking for high-friction contact details.
Technical Speed and Mobile-First Architecture
The foundational layer of modern UX is uncompromising technical performance. Mobile platforms dominate digital discovery, yet the average mobile page load time across unoptimized sites remains a sluggish 8.6 seconds. This is a catastrophic failure point, as Google’s analytics confirm that 53% of mobile visitors will abandon a session entirely if the page takes longer than three seconds to render.
Conversely, pages that load in under one second experience conversion rates three times higher than those loading in five seconds. Every additional second of latency compounds the conversion loss by approximately 7%. Achieving sub-second speeds requires ruthless technical optimization: critical Largest Contentful Paint (LCP) images must be aggressively compressed and never lazy-loaded, while non-essential JavaScript must be deferred to prevent main-thread blocking.
Trust Signals and Multimedia Integration
In high-stakes transactional environments, risk mitigation is as critical as benefit promotion. The strategic placement of trust signals provides a massive psychological advantage. Integrating named client testimonials—specifically featuring job titles and recognizable company logos—increases conversions by an average of 34%. When these trust badges and security seals are placed directly adjacent to the lead capture form or primary CTA, the relative lift can jump by an additional 42%, as they actively reduce anxiety at the exact moment of commitment.
Additionally, the integration of multimodal assets significantly impacts user engagement. Embedding high-quality product demonstration videos on landing pages helps users retain 95% of the intended message and has been statistically proven to increase conversion rates by up to 86%.
Integrating UX with AI: Generative Engine Optimisation
In the digital landscape of 2026, UX modifications cannot be designed solely for human psychological engagement; they must be simultaneously architected for machine extraction. The introduction and dominance of the Search Generative Experience represents the most significant structural shift in digital marketing history, transitioning search from traditional indexing to complex, multimodal AI synthesis.
The Mechanics of Answered Engine Optimisation
As Google’s Gemini models and other autonomous AI agents take precedence, organizations must master Answered Engine Optimisation and Generative Engine Optimisation to maintain visibility. These disciplines focus on making website content highly structured, explicit, and machine-queryable. When an AI agent formulates an overview, it bypasses generic marketing prose in search of factual density, clear entity relationships, and unambiguous answers.
The UX structures that drive human conversions—such as bulleted lists, clear heading hierarchies (H2, H3), and concise introductory paragraphs—perfectly align with the extraction preferences of generative AI. An “Answer-First” UX architecture, which leads a section with a direct 40-to-60-word summary before expanding into deeper context, caters to human scanning behaviors while providing the exact format required for an AI to cite the brand as a source of truth.
Structured Data and the Semantic Web
To ensure that autonomous agents can confidently verify and ingest page data, advanced UX must be underwritten by exhaustive Schema markup. Schema acts as the translation layer between unstructured visual design and machine-consumable knowledge objects.
Critical schema implementations for 2026 landing pages include:
LocalBusiness: Feeds highly accurate physical and geographic data directly into AI location services, essential for targeting specific regional markets.
Product: Enables seamless integration with universal shopping graphs, requiring live pricing, currency definitions, and active inventory markers.
FAQPage: Maximizes direct extraction for instant answer engines, statistically yielding up to a 5x increase in generative citation frequency.
Review: Validates the visual trust badges displayed on the UX level, providing aggregate, machine-readable scoring to the underlying AI models.
Crucially, the technical execution of the UX must not obstruct AI crawlers. Many aesthetic UX frameworks rely heavily on client-side JavaScript rendering, which can obfuscate vital content from Large Language Models (LLMs). A landing page must serve critical informational content in raw, server-side rendered HTML to guarantee comprehensive indexing and AI citation.
Translating Lift into Pipeline Revenue and ROI
Once a landing page has been architected for AI visibility and human conversion, and a statistically significant relative lift has been validated, the final step in the analytical process is monetization. The ultimate responsibility of the marketing apparatus is to translate the percentage lift into incremental leads or revenue, comparing the results against actual business impact, not just a better-looking rate.
Mapping the Business Case
To accurately translate the lift, an organization applies the validated relative improvement percentage to its existing traffic volume and baseline deal economics. Consider the mathematical model for a mid-market B2B service provider evaluating a recent UX optimization cycle:
Establishing the Baseline Status: The enterprise’s primary service landing page consistently generates 10,000 unique organic visitors per month. The baseline conversion rate (form submissions) is strictly measured at 1.5%. Therefore, the page historically generates 150 Marketing Qualified Leads (MQLs) per month.
Validating the UX Improvement: The enterprise undergoes a strategic UX overhaul—removing navigation, reducing form fields, increasing mobile load speed to under 1.5 seconds, and optimizing schema for Generative Engine Optimisation. Following a strict 21-day sequential A/B test, the new conversion rate stabilizes at 2.1% with 99% statistical confidence.
Calculating the Relative Lift: Applying the formula, the enterprise has achieved a massive 40% relative lift.
Quantifying Incremental Volume: The 40% relative lift means the page now extracts 210 leads per month from the exact same 10,000 visitors. This results in an incremental gain of 60 highly qualified leads per month, achieved without spending a single additional dollar on traffic acquisition.
Calculating the Revenue Impact
The true value of Conversion Rate Optimization is revealed when these incremental leads are pushed through the sales pipeline. If the enterprise maintains a historical lead-to-close rate of 20%, those 60 incremental leads will reliably generate 12 additional signed contracts per month.
Assuming the average Customer Lifetime Value (LTV) for the enterprise is $15,000, the financial impact is profound. The 12 additional closed deals inject $180,000 of incremental revenue into the pipeline every single month. In this scenario, a seemingly modest 0.6% absolute increase in the landing page conversion rate directly drives over $2.1 million in annualized revenue growth. This mathematical reality underscores why data-driven UX optimization is universally considered one of the highest-leverage activities in modern corporate strategy.
The Role of SEO Consultation in Mitigating Risk
While the financial rewards of UX optimization are substantial, the process of altering digital assets in the AI era carries inherent risks. Modifying a high-traffic landing page to improve conversion rates can inadvertently destroy its organic search rankings if technical SEO principles are violated during the redesign.
For an enterprise navigating this complex ecosystem, securing the expertise of a professional SEO Consultant Selangor provides critical risk mitigation. A seasoned consultant ensures that during the UX optimization process, primary ranking signals—such as semantic URL architecture, Title Tags, H1 assignments, and existing internal link equity—remain stable. Furthermore, professional Marketing consultation ensures that any A/B testing platforms utilized do not create duplicate content issues or cloaking penalties that could trigger search engine demotions. By bridging the gap between conversion psychology and machine-readable technical architecture, a strategic consultant guarantees that efforts to maximize revenue do not accidentally sabotage visibility.
Conclusion
Calculating conversion rate lift from improved landing page UX is a rigorous, highly scientific discipline that rejects guesswork in favor of mathematical certainty. By defining an uncontaminated baseline, isolating audience variables, and correctly calculating relative lift, enterprises can accurately diagnose the utility of their digital assets. When these calculations are subjected to strict statistical significance thresholds and successfully translated into tangible pipeline revenue, UX optimization proves itself as the ultimate catalyst for corporate growth. In the hyper-competitive, AI-driven digital landscape of 2026, seamlessly integrating these conversion methodologies with advanced SEO Marketing frameworks is not just a competitive advantage; it is the definitive blueprint for sustainable commercial dominance.
Frequent Asked Questions
Why is establishing a clean baseline period critical before testing a new landing page UX?
A clean baseline period ensures that the data is not contaminated by external variables such as seasonal sales spikes, holiday traffic fluctuations, or sudden search engine algorithm updates. Without a stable historical reference point utilizing the exact same traffic mix and device parameters, it is mathematically impossible to determine if a change in conversion rate was caused by the new UX design or merely by external market noise. For professional assistance in setting up accurate analytics baselines, enterprises are encouraged to visit the Contact Us page.
What is the fundamental difference between an absolute percentage increase and a relative conversion rate lift?
An absolute increase simply measures the raw difference between two numbers (e.g., subtracting a 5% baseline from a 6% new rate equals a 1% absolute increase). In contrast, a relative lift calculates the percentage of total growth based on the original figure (e.g., shifting from 5% to 6% represents a 20% relative improvement). Relative lift is the standard business metric because it accurately reflects the real-world proportional increase in leads and revenue. To learn how to construct advanced revenue models, schedule a strategic review via the Contact Us portal.
How long must a landing page UX test run to ensure statistical significance and avoid false positives?
Statistical rigor dictates that A/B tests should run for an absolute minimum of 14 days to capture full behavioral cycles across weekdays and weekends, regardless of how quickly total traffic accumulates. Furthermore, the test must achieve a 95% statistical confidence level to ensure the observed relative lift is not the result of random variance or anomaly. Organizations requiring expert management of complex testing environments can secure dedicated support at the Contact Us page.
How does landing page UX architecture influence Generative Engine Optimisation in 2026?
In 2026, advanced AI search engines evaluate technical page structure, rendering speeds, and behavioral metrics to determine a brand’s citation worthiness. A landing page engineered with exceptional UX—featuring clear heading hierarchies, sub-second load times, and comprehensive structured data (Schema)—is significantly more likely to be extracted and cited by AI overviews, thereby driving highly qualified, pre-vetted traffic. To upgrade a domain’s AI-readiness, request a technical audit via the Contact Us page.
Why is removing the primary navigation bar recommended for high-converting landing pages?
Removing standard website navigation elements from a dedicated landing page eliminates visual “escape routes” and drastically reduces the user’s cognitive load. This architectural decision forces the visitor’s focus entirely onto the primary value proposition and the single Call to Action, a tactic that frequently results in a massive relative increase in conversion rates. To evaluate an existing landing page structure, secure a professional UX consultation at the Contact Us page.